Liar Loan said:
The last time you demanded data proving my point about the 2018 Irvine decline, Cares helpfully stepped in and provided it. USCTrojanCPA also used to provide it, but maybe he's too busy these days. Larry uses the same data source (MLS sales) as these other two, and all three have proven you wrong time and time again.
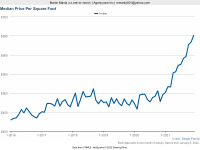
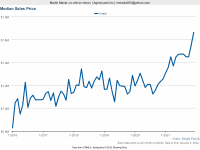
This was never proven. Redfin chart doesn't show a 2018 "decline" outside of the nominal seasonal drops.
What was that percentage drop? Was it outside the norm? I recall that's where it left off and like usual, you did not respond.
Who else thinks there was an 2018 Irvine slump? And... let's be clear here... you said it was only in Irvine... which I don't think is proven either.
Anyone else here believe in LL's call of the infamous 2018 Irvine only slump?
")