curious george
Member
I'v noticed randomly several price reductions, is that how it starts?
curious george said:I'v noticed randomly several price reductions, is that how it starts?
Kenkoko said:I think the market turned cool much faster than most anticipated.
Take this house for example
https://www.redfin.com/CA/Irvine/4601-Green-Tree-Ln-92612/home/4702678#overview
They started too late (September) and too high at 1.04 mil when the sold comps were 1.05mil - 980k.
Dropped price to 999k after just one month
Dropped price to 925k after another 6 weeks and finally went pending.
irvinehomeowner said:Kenkoko said:I think the market turned cool much faster than most anticipated.
Take this house for example
https://www.redfin.com/CA/Irvine/4601-Green-Tree-Ln-92612/home/4702678#overview
They started too late (September) and too high at 1.04 mil when the sold comps were 1.05mil - 980k.
Dropped price to 999k after just one month
Dropped price to 925k after another 6 weeks and finally went pending.
On the plus side, I'm sure even $925k has a ton of equity.
I can't believe this 1969 attached townhome with what looks like no upgrades is going to sell for $900k+.

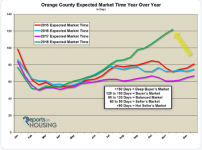
IrvineRealtor said:Increased inventory is also an indicator, along with (or as a result of) reduced # of transactions, so I'd recommend for those concerned to keep an eye on the MOI figures (that get overlooked by many).
This ^^^ will give you an idea of the overall market, but keep in mind each transaction is made on the margin. Someone is willing to pay what someone is willing to part with, each hoping to act in their own best interests. Sometimes, even though the market is hot, there are sellers that are willing to sell for less given their own personal circumstances. And contrarily, even in a slow market a property can go for more than expected, which can be a frustrating buying dilemma.
As the MOI increases, the market shifts more towards the buyers' advantage, whereas a lower MOI is more indicative of a market where sellers have more general strength.
A "balanced" market carries about 3 months of inventory, roughly.
Hope this helps,
-IR2
irvinehomeowner said:I can't believe this 1969 attached townhome with what looks like no upgrades is going to sell for $900k+.
Kenkoko said:irvinehomeowner said:I can't believe this 1969 attached townhome with what looks like no upgrades is going to sell for $900k+.
If you find 900k hard to beleive, this one was even higher. >
https://www.redfin.com/CA/Irvine/4432-Sandburg-Way-92612/home/4702397#overview
The was the very same model at a worse location. (not a corner unit) but it closed for 980k. It was on the market just a bit late (August) but priced better and probably got a bidding war and came away 40k above asking. This is the comp that the Green Tree ln seller was probably chasing.
The seller is still walking away with big gains but could have been a lot more had they gone to market sooner or priced it better. Ouch!
meccos12 said:IrvineRealtor said:Increased inventory is also an indicator, along with (or as a result of) reduced # of transactions, so I'd recommend for those concerned to keep an eye on the MOI figures (that get overlooked by many).
This ^^^ will give you an idea of the overall market, but keep in mind each transaction is made on the margin. Someone is willing to pay what someone is willing to part with, each hoping to act in their own best interests. Sometimes, even though the market is hot, there are sellers that are willing to sell for less given their own personal circumstances. And contrarily, even in a slow market a property can go for more than expected, which can be a frustrating buying dilemma.
As the MOI increases, the market shifts more towards the buyers' advantage, whereas a lower MOI is more indicative of a market where sellers have more general strength.
A "balanced" market carries about 3 months of inventory, roughly.
Hope this helps,
-IR2
Thanks for the post IR2. I assume MOI stands for months of inventory? If you look at MOI to give an idea of the strength of the market, would you also look to "expected days on the market" since this metric gives a similar picture as MOI?