Observations from the front lines of the Irvine housing market?

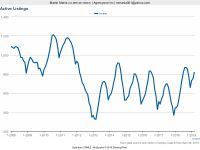
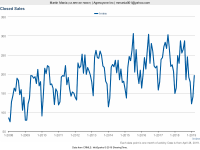
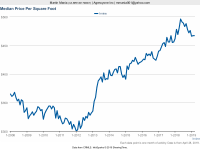
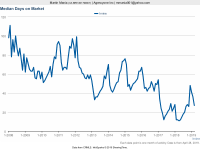
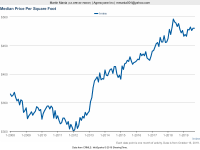
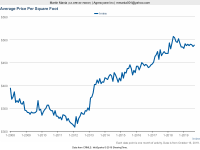
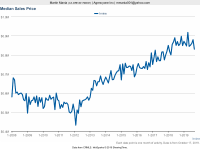
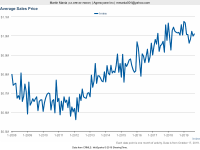
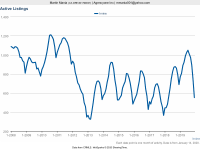
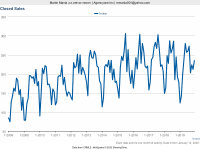
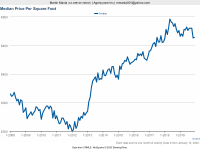
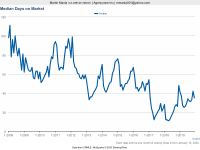
And here are a few 10-year charts to put things into perspective for active listings, home sales, median price per SF, and days on market for all the folks that are more visual. ;)


Attachments

  • 1111.png
    1111.png
    35.7 KB · Views: 292
  • 1222.png
    1222.png
    46 KB · Views: 300
  • 1333.png
    1333.png
    34.2 KB · Views: 301
  • 1444.png
    1444.png
    37.6 KB · Views: 295
irvinehomeowner said:
The Closed Sales chart is still looking cyclical to me. :)

Uh oh, I think you might have poked the bear. haha 

Btw, I'm curious....would you guys prefer to see 5 year charts or stay with the 10 year charts going forward?
 
irvinehomeowner said:
10 year is good because it covers the last "real" downturn (although may have to expand out to 11 or 12 years). :)

10 years is as far back as I can capture the data on the graphs and I think it gives a good representation of where things are in comparison during the true buyer's market in 2009-2011.
 
USCTrojanCPA said:
irvinehomeowner said:
10 year is good because it covers the last "real" downturn (although may have to expand out to 11 or 12 years). :)

10 years is as far back as I can capture the data on the graphs and I think it gives a good representation of where things are in comparison during the true buyer's market in 2009-2011.

I bought right in the middle of that, JIMHO that was not a buyers market.  That was a totally ---ked up market.  There weren't a lot of forced sales or weak hands.  In fact many of the 'weak' hands were short sales, like we bought, that had multiple people involved, one with a quazi interest in the deal not going thru, one with nothing to lose if it goes south and the prinicpal, the bank, who didn't need to recognize the loss and hit to their until it actually sold.

You could offer the full asking price, in cash and be the highest and only viable offer and the deal wouldn't happen.

Or you hit the other extreme, the home has 22 offers as soon as it was put on the market goes taking back ups, in escrow for month, and back, repeat.

That's not a buyers market.

 
nosuchreality said:
USCTrojanCPA said:
irvinehomeowner said:
10 year is good because it covers the last "real" downturn (although may have to expand out to 11 or 12 years). :)

10 years is as far back as I can capture the data on the graphs and I think it gives a good representation of where things are in comparison during the true buyer's market in 2009-2011.

I bought right in the middle of that, JIMHO that was not a buyers market.  That was a totally ---ked up market.  There weren't a lot of forced sales or weak hands.  In fact many of the 'weak' hands were short sales, like we bought, that had multiple people involved, one with a quazi interest in the deal not going thru, one with nothing to lose if it goes south and the prinicpal, the bank, who didn't need to recognize the loss and hit to their until it actually sold.

You could offer the full asking price, in cash and be the highest and only viable offer and the deal wouldn't happen.

Or you hit the other extreme, the home has 22 offers as soon as it was put on the market goes taking back ups, in escrow for month, and back, repeat.

That's not a buyers market.

You put that in a perfect context. When chaos set-in, one would think that a reasonable offer would get banks and buyers to collaborate and close the deal, but it did not happen that way. I remember clearly, like you describes here. One of my neighbor whom was at that time in 2008 stop making payment and the house went on foreclosed. It was back-and-forth, listed and de-listed, backup and relisted. This went on for almost 3 years until it sold in mid 2013. Imagine from 2008 to 2013. Yeah it was that long, and several buyers and agents showed up and not able to buy. That market then was truly bizzare. For those waiting to jump in and timing the market to buy at the discount, get ready for an emotional roller coaster like you never have before.

And in this market I believe we will never ever get to that level. The FED and the Banking Cartel are much better prepare this time to stop the mania from happening. The FED already in so many words started to implement QE, Quazi Easing, as we know it. They will never tell the whole truth about the actions, but the fact that the buy back policies, is back at the table tell me that this market will continue to float upward.

Yes, delaying it and continue to have a functional market is preferable compare to the hell-freeze over. And given the election year, this is going to be a long long wait. If I was on a sideline and ready to act, now I think would be a prefer time.
 
irvinehomeowner said:
@USC:

Can you post your 10-year charts again?

Here are both the median and average price per SF for Irvine for the past 10 years.
 

Attachments

  • 1.png
    1.png
    34.5 KB · Views: 158
  • 2.png
    2.png
    33.5 KB · Views: 142
irvinehomeowner said:
Can you give us just a median or average sold price?

The first one is median home prices and the second one is average home prices.
 

Attachments

  • 3.png
    3.png
    37.8 KB · Views: 280
  • 4.png
    4.png
    43.3 KB · Views: 241
irvinehomeowner said:
Thanks USC!!

Is there an Excel/csv download of the average/median price by month? It's hard to data churn off the chart.

Here's the Excel file for both...
 

Attachments

  • Median & Average Sales Price-Irvine.xlsx
    16 KB · Views: 110
I have a question, is median price/sft actually better than just looking at median price?

I think it is because it takes into account home size but at the same time, there are other factors that it doesn't cover like room, bathroom count, lot size etc (which median price doesn't cover either).

I remember on the old IHB forums, $/sft was the number everyone was concentrating on.
 
irvinehomeowner said:
I have a question, is median price/sft actually better than just looking at median price?

I think it is because it takes into account home size but at the same time, there are other factors that it doesn't cover like room, bathroom count, lot size etc (which median price doesn't cover either).

I remember on the old IHB forums, $/sft was the number everyone was concentrating on.

Yeah this was a hard thing for us to measure since we wanted specific things since we were in the attached condo price range. End unit, two stories, attached 2 car garage. These things are hard to value so you have to find specific examples of sales in the area, which isn?t easy if there only exists a few of that plan in each community since less for sale or sold recently.
 
jamesKirk said:
irvinehomeowner said:
I have a question, is median price/sft actually better than just looking at median price?

I think it is because it takes into account home size but at the same time, there are other factors that it doesn't cover like room, bathroom count, lot size etc (which median price doesn't cover either).

I remember on the old IHB forums, $/sft was the number everyone was concentrating on.

Yeah this was a hard thing for us to measure since we wanted specific things since we were in the attached condo price range. End unit, two stories, attached 2 car garage. These things are hard to value so you have to find specific examples of sales in the area, which isn?t easy if there only exists a few of that plan in each community since less for sale or sold recently.

So did you go for Delano?
 
It's been a while since I posted data and to say that 2019 was an interesting year with Irvine real estate would be an understatement so I wanted to provide my interpretation of what occurred. In terms of sales and prices, the Irvine market was essentially flat from a year over year perspective. That being said, there was a lot of action throughout the year. The year started off weak as there was an overhang of resale and unsold new home inventory that pushed prices down in the second half of 2018. Then the 30-year fixed rate started dropping at the beginning of 2019 after it kissed 5% in Nov 2018 and we ended up the year with the 30 year fixed rate around 3.50% (the low was around 3.25% in Sept 2019). Inventory levels hit a high of 1,049 homes on the market in July 2019 which was an increase of over 30% YOY. The market was a weak buyer's market overall in 1Q 2019 as we had 5+ months of inventory on the market with 20% YOY sales declines. While resale inventory kept rising into the summer, sales volumes were up slightly YOY which caused the months of resale inventory to decline to about 4 months worth of supply on the market. We saw a significant increase in sales volume and drop in resale inventory YOY in the last 2 months of the year. The median Irvine home price ended up essentially flat in 2019 around the mid $470/sf range. 

As rates started to drop to 4% in Jan/Feb, my lower end buyers came off the sidelines first (this group is more sensitive to their total monthly payment) and I started encountering multiple counter offer situations. Then in the Spring as rates kept dipping towards 3.50%, my middle market and high end buyers started becoming active in the market. These middle market and high end buyers had a lot more inventory to pick from, including standing inventory new homes, so we would make offers under list to determine how motivated sellers were. That being said, middle and higher end homes that were priced price, showed well, and/or had unique features such as larger or view lots sold fairly quickly. From the new home side, builders bumped up their broker co-op in late 2018/early 2019 to better incentivize agents to bring their buyers in to their sales offices.  They were also willing to negotiate both on price and credits for unsold homes and the closer the home was to being completed the more negotiable they were. Irvine Pacific even responded by building 2 smaller, lower priced models at Terra and Ravello in Orchard Hills due to the slow down.

As I mentioned, interest rates kept dropping from late 2018 when rates touched 5% all the way down to 3.25% in the fall of 2019 (mainly due to the China tariff worries). The Fed ended up cutting rates 3 times for a total of 0.75% and stopped quantitative tightening (some would argue that they restarted a form of quantitative easing to help the repo market out in 4Q). We ended the year with the 30-year rate around 3.50% as we got word of a phase 1 tariff agreement between China and the US. The market rallied significant in 4Q which might have been the factors why more buyers came into the market in the last quarter of the year and into 2020.

Many of my listings and purchases in the second half of 2019 were move-up buyers who sold their small homes and bought larger homes and that is continuing into 2020. I also have a few job relocation (significant compensation increases) related transactions on the buy and sell side, including helping a few buyers purchase homes in San Diego and Santa Cruz. That was a function of the continued strong job market that we are seeing and besides low rates is a key driver in the increased buyer activity. In my opinion, the market continues to be trifurcated with the lower end of the market (sub $800k) being strong, the middle market ($800k-$1.2ish) being neutral, and the higher end ($1.3m+) being soft based upon the sales volume and inventory levels. 

So what will 2020 bring? Tough to say, we have a presidential election coming up and phase 2 China trade talks will begin along with potential turmoil in the Middle East. In 2016, I noticed that some buyers pulled back in the summer/fall as there was uncertainty of who would be elected as president and how the market would react. We may have the same thing happen this year if there is a similar type of uncertainty this time. But if the market gets what it wants, we can expect a pick up in demand (assuming the job market stays strong, China tariffs don't flare up again, and rates stay in the 3s) after the election in late 2020/early 2021. I feel that 2020 will effectively be flat with 2019 from both a sales and price perspective and the market will remain balanced/neutral for the most part. As always, inventory levels will provide a hint of where the market might be heading.
 

Attachments

  • Irvine Sales & Inventory Data - Dec 2019.xlsx
    39 KB · Views: 63
Below are 10-year charts for active listings, home sales, median price per SF, and days on market from MLS.
 

Attachments

  • Active Listings.png
    Active Listings.png
    35.8 KB · Views: 142
  • Closed Sales.png
    Closed Sales.png
    46.7 KB · Views: 139
  • Median Prices.png
    Median Prices.png
    34.3 KB · Views: 176
  • DOM.png
    DOM.png
    37.8 KB · Views: 146
So early-mid 2018 was the worst time to buy both in terms of the price and the rates.. unless the market picks up and the price goes up in a future.
 
Mety said:
So early-mid 2018 was the worst time to buy both in terms of the price and the rates.. unless the market picks up and the price goes up in a future.

Yes, that was the last price peak and rates around the mid 4% range. Since then, rates have come down a lot (about 1%) and prices came down less so (slightly down on the lower end and down more on the higher end).
 
Back
Top