Housing Analysis

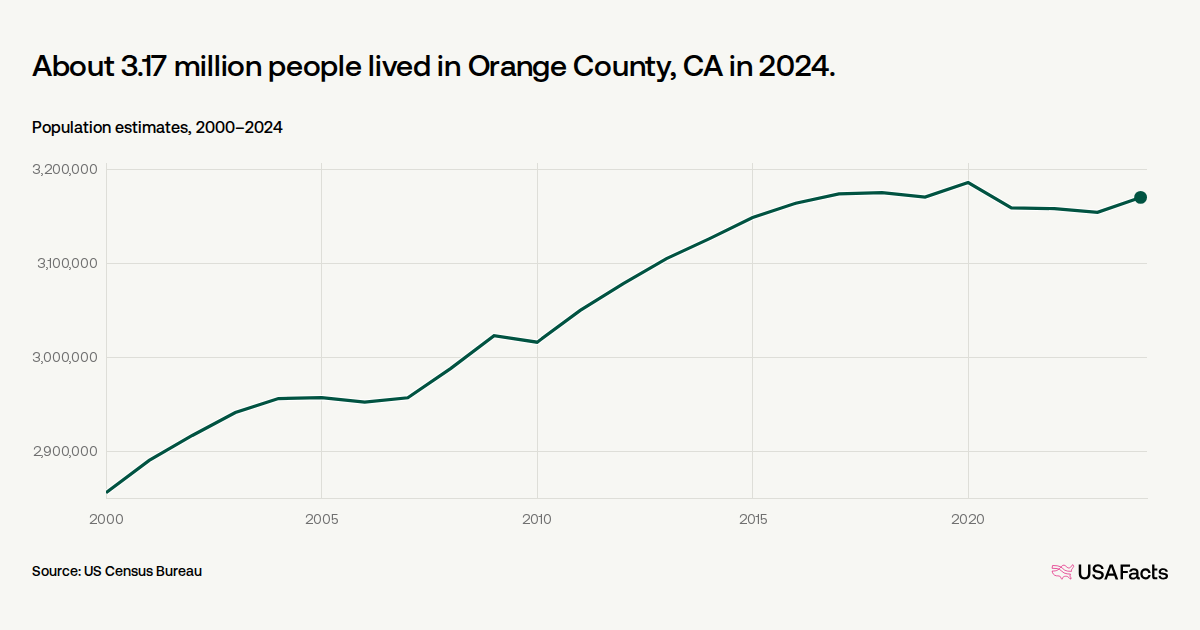
OC actually has fewer people now than it did in 2016 and the downward trend is only going to accelerate. This will continue until the cost of living comes down to the point that average families can afford to live here again. Irvine will not be immune from these trends, just as it has never been immune from the price trends affecting all of Orange County.

1700079757476.png

 
Last edited:
So far... 2 stock market falls, real estate crash, pandemic, strict Chinese money rules, high interest rates, bad presidents (depending on what side you are on), wars, decreasing population and yet new Irvine tract homes are approaching the $5m mark.

Magic 8-Ball is broken, fundamentals have left the building.
 
Smart money will do their best to keep it smart, buy where its safe for decades. Tracts or not, what I see consistent, is that it weathers the up and down. Especially when it up, its up alot. Newport, Laguna, CDM, Irvine all fall into this category, also south county OC, but you gotta work with a good local agent for South County, Buy something that the FED and our politician can't dilute. Its really is hard now especially to build affordable homes. The costs and legislatures are prohibitives for lower prices. When inflation fall, it still high because the previous 4 years inflation is staying. So inflation is say 4 % of the 40 % of the past 4 years add on prior to the "PLANDEMIC". Simple math, but high prices in desireables hoods are here to stay.

Pretty depressing to me....
I just like that you used the word plandemic <3
 
I just like that you used the word plandemic <3
Don't let a crisis goes to waste. That's the best time to fix the problems that was created.

There was a saying, from our politicians saying this "If you think my solutions to the problems that we've created was brilliant, wait until the see the problem that will arise, soon...." ha ha, brilliant.
 
We’re looking for an entry level place to hold as an investment. Two months ago, the market was different, then the interest rates started to soften. It’s a complete nuthouse on the low end right now.

Bleak is an understatement. I don’t mean for us, just in general. Absolutely insane the requirements for someone to buy a starter.

$750K, multiple offers, line out the door to see a gut to the studs with so-so bones early 80s build 2/3 with small rooms and sub 1200sf squeezed into two stories and two shared walls.

$650K sub 1000sf, middle sandwich unit in a Soviet-esque block apartment building 2/2, no private garage, dank halls, vintage 80s tile, carpet, appliances and countertop. Would have been a decent college apartment 40 years ago.
 
Last edited:
Great news for recent Irvine home buyers -- own your home for at least 12 years to eliminate any risk of loss! This is why timing the market matters so much. Even after owning for 12 years, some buyers don't break even once inflation is factored in.

Want a risk-free California home purchase? Own it for 12 years​

California prices fell in 30% of the 12-month periods since 1987.

Since 1987, owning a California home for 48 months had 27% losing periods. Not much of an improvement.

Next, look at 8-year ownership. History shows 21% losing periods...

Even owning for a decade wasn’t risk-free since 1987. Over 10 years, there were still 9% losers...

A Californian had to own for 12 years to have no declining periods since 1987.

PS: When I used the California Association of Realtors’ median home price, dating to 1990, for the same math it took 14 years for risk-free ownership.

Interesting perspective, though the author seems to ignore carrying costs. On the other hand, I suppose one could argue carrying costs are moot if rent vs buy consideration is in parity over the same time periods since a person would need a place to live whether they own or rent.
 
Incomes are practically flat since 2019 while home prices have gone up 40%.

image
 
Notice a trend here of a 15 year real estate cycle? Perhaps the housing market will bottom out in 2027. The chart from 2006-2008 looks similar to 2021 to 2023. In 2023, 4.09 million existing homes were sold, the fewest since 1995. I am calling the peak in home prices Sept 2023 and will bottom in 2027. This also depends on the demographics / net population by each MSA cities. I hope I am wrong, but 2008 - 2012 is going to look a lot like 2023 - 2027. We are currently in 2024 which is aligned to 2009 in the 15 year cycle. As some of you veteran TI members can remember, March 2009 was when the stock market crashed 67% in the S&P.

2008 4.13 2023 4.09
2009 4.34 2024 4.30 (est.)
2010 4.18 2025 4.18 (est.)
2011 4.26 2026 4.26 (est.)
2012 4.66 2027 4.66 (est.)


sa.jpg
 
Last edited:
Orange County Unemployment Chart and the 10 year - 2 year Chart.

Notice that the Unemployment chart in OC never moves in a horizontal line but more a wave pattern. Once the employment rates hits 5% will start to accelerate quickly. The grey bar shows the previous recessions in the U.S. Same thing in the inverted yield. Recession comes 4-6 months after the yield inversion.

Again, I hope that my forecast is wrong.

10yea.jpg
 
Last edited:
The FED has broken so many metrics.

The sins of easy money was held for far too long.

The data dependent FED, need to step aside and let the market do the proper market discovery and allow a proper cleansing.

What is the point of 20/hrs fast food workers when robots do far cheaper better job without complaints.


If we only allow pains takes place then it will be good for all.
 
Active listings are the highest in four years, and price reductions are the highest in eight years for the month of March. But poor IHO predicts the recent spike in mortgage rates will lead to less inventory.

Home Sales Clobbered by Mortgage Rates. New Listings & Active Listings Surge. Most Price Reductions for any March in Years​

Active listings rose to the highest level since before the pandemic, to 695,000 active listings in March, according to data from Realtor.com. Compared to March in prior years:
  • March 2023: +23.5% (green)
  • March 2022: +96.3% (black)
  • March 2021: +57.7% (yellow)
1713549047850.png


Price reductions jumped to 31.7% of active listings, the highest for any March in the data released by Realtor.com going back through 2017. It indicates that sellers are grappling with reality and are trying to make deals:

1713549084684.png


Attachments

  • 1713549216833.png
    1713549216833.png
    114.1 KB · Views: 0
Never said it will lead to less inventory... what I said was a high rate era after a low rate era will suppress inventory which your own chart proves.

What was inventory in 2018-2020 compared to 2024?
 
The ultra-low interest rates lasted until December 2021 and inventory bottomed two months later. Inventory is not suppressed - It's 96% higher than it was two years ago after bottoming out. It's just that ultra-low interest rates caused inventory to get so depleted, that it's going to be a multi-year process to get inventory back to normal levels.

The recent increase in rates isn't going to suppress inventory, but it will suppress marginal buyers that can no longer afford to buy.
 
Uh... interest rates in 2018-2020 were lower than now.

I am excluding the Covid era because of obvious non-fundamental aspects.

Since you like charts (but can't read them):

1713563393185.png

Look at rates from 2018-2020, look at inventory on your chart. Now look at rates from 2022 to 2024, what is inventory then?

QED.
 
Last edited:
Uh... interest rates in 2018-2020 were lower than now.

I am excluding the Covid era because of obvious non-fundamental aspects.

Since you like charts (but can't read them):

View attachment 9672

Look at rates from 2018-2020, look at inventory on your chart. Now look at rates from 2022 to 2024, what is inventory then?

QED.

Because of what that chart shows from 2017-2019 I believe that when rates normalized they will range between 4-5%.
 
Back
Top