Macro Economics and Personal Finance

Marco Economics : Understanding Unemployment Rate and Gross Domestic Product (GDP)
U.S. Unemployment Rate

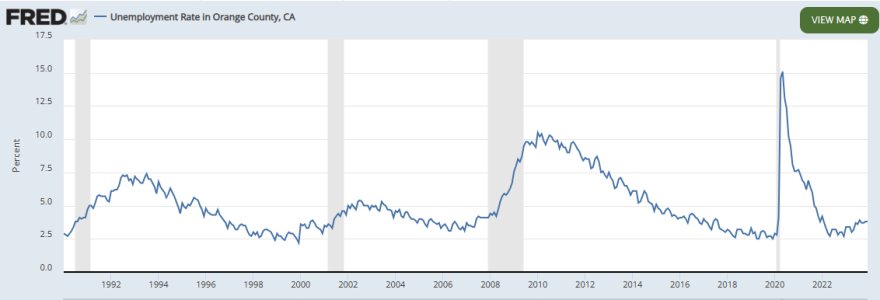
Unemployment statistics measure the percentage of people in the United States who are working vesus out of work. There are several measures for this statistic, but the most common is referred to as the U3 unemployment rate. It is considered the official unemployment number and measures the percentage of U.S. residents who are out of work but have looked for work within the previous four weeks.

In a healthy economy, we expect the U3 unemployment rate to be in the range of 4 to 5 percent. When the unemployment creeps above this market, it's typically a signal that the economy is weakening.

For example, in Dec 2007, the beginning of the last recession), the national unemployment rate was 5%. By the end of the recession in June 2009, it had increased to 9.5%. In Oct 2009, it peaked at 10% four months after the recession ended.

Just as an increasing unemployment rate is cause of concern, so is a very low unemployment rate. When the unemployment rate gets under near 4% and below, we generally consider the nation to be at full employment.

Full employment is good short term because it means many Americans are gainfully employed. However, it's also a precursor to inflation, which will be a drag on the economy. Full employment has historically been a signal that a downturn or a deep recession is right around the corner.

uem.jpggdp.jpg
 
Real Estate Economics : Understanding Housing Supply

Although real estate markets are localized, and national trends may not represent what's happening in your area, there's value in looking at the national housing market. One way to look at the overall economic health is the housing supply.

Housing Supply is sometimes referred to as housing inventory or day on the market (DOM), and is the average amount of time it takes to sell a house in a particular market. The more demand there is for housing, the less time a typical house stays on the market for sale before being put under contract.

On average, housing supply accross the country is around 6 month. When supply drops below 6 months, there's more than average housing demand (the housing market is strong). Then supply increases above 6 monhts, there's less than average housing demand (the housing market is showing signs of weakness) This is how things used before the pandemic in March 2020.

We currently have high borrowing costs (high mortgage rates) and high home prices across the nation, and inventory is starting to rise across the nation.

montly.jpgstart.jpg
 
Last edited:
What is interest is that the LA home prices > SF home prices. Seems that LA home prices also holding up better than SF. Chicago housing was always around 20% more expensive than Atlanta, but starting in 2018, home prices in Atlanta are now 20% more expensive than Chicago.

atl.jpg
 
Last edited:
Research by Author of Millionaire Next Door : Thomas J Stanley, PhD

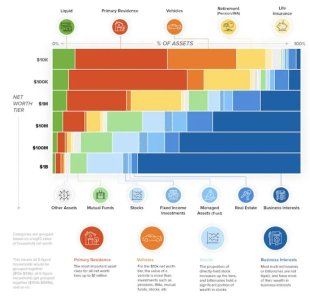
Table 2.2 Homes of Millionaires in America : Average Value by Augmented Networth.

Net Worth: Market Value of Primary Residence Value of Home as % of Networth
$1,493,804 $404,240 27.1%
$3,416,267 $620,779 18.2%
$6,859,864 $1,034,411 15.1%
$13,687,961 $1,818,699 13.3%
$59,919,891 $2,735,436 4.6%

networth.jpg
 
Last edited:

Fed holds interest rates at 23-year high, citing 'lack of further progress' on inflation​

The Fed will not cut rates in the Apr/May meeting and June meeting. The Fed raised rates too late to fight inflation. They will again start to cut rates too late. They will not cut because the inflation is headed towards 2%, but will be forced to cut. Welcome to Bidenomics, a broken economy with fake economic and unemployment numbers that doesn't seem to make sense.

Fed Meetings:

Apr/May 30-1
June 11-12
July 30-31
Sept 17-18
Nov 6-7
Dec 17-18
 
April 26th, 2024

The Fed will not cut rates in the Apr/May meeting and June meeting. The Fed raised rates too late to fight inflation. They will again start to cut rates too late. They will not cut because the inflation is headed towards 2%, but will be forced to cut. Welcome to Bidenomics, a broken economy with fake economic and unemployment numbers that doesn't seem to make sense.

Fed Meetings:

Apr/May 30-1 (Will keep Interest Rates Same)
June 11-12 (Will keep Interest Rates Same)
July 30-31
Sept 17-18
Nov 6-7
Dec 17-18


powell.jpg
 
Back
Top